Multiple Choice
The figure given below shows the demand curves of two classes of buyers, for tickets to a football match.Figure 11.4
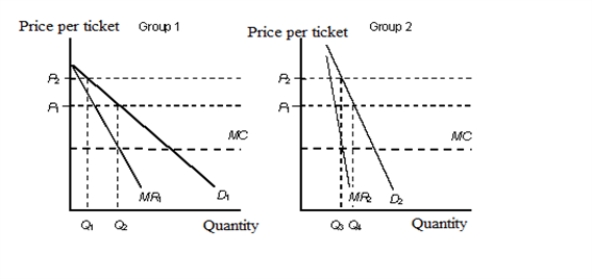 D1: Demand curve of group 1
D2: Demand curve of group 2
MR1: Marginal revenue of group 1
MR2: Marginal revenue of group 2
MC: Marginal cost
-Compared with a perfectly competitive market with similar cost conditions, a monopolist will have:
A) a higher output and a lower price.
B) a lower output and a lower price.
C) equal output and a higher price.
D) a lower output and a higher price.
Correct Answer:

Verified
Correct Answer:
Verified
Q53: The figure given below shows the cost
Q54: The figure given below shows the cost
Q55: The following figure shows the revenue curves
Q56: The figure given below shows the cost
Q57: The table given below shows the price,
Q59: The table given below shows the price,
Q60: The figure given below shows the aggregate
Q61: The following table shows the units of
Q62: The figure given below shows the cost
Q63: The following figures show the demand and