Multiple Choice
The following figures show the demand and cost curves of a perfectly competitive firm and a monopoly respectively.Figure 11.7
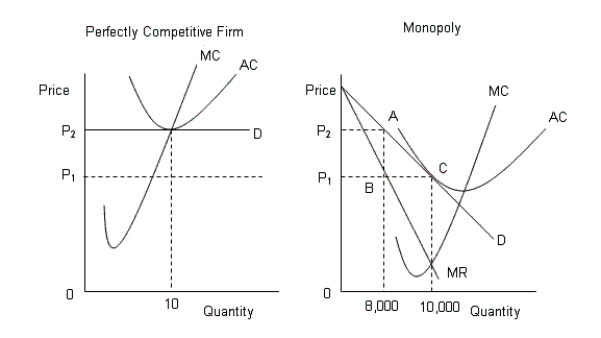 D: Average Revenue
AC: Average cost
MC: Marginal cost
MR: Marginal cost
-Refer to Figure 11.7. If the perfectly competitive industry and the monopoly produces the same quantity, then:
A) there are 10 firms in the perfectly competitive industry.
B) there are 800 firms in the perfectly competitive industry.
C) there are 1,000 firms in the perfectly competitive industry.
D) there are 2,000 firms in the perfectly competitive industry.
E) there are 100 firms in the perfectly competitive industry.
Correct Answer:

Verified
Correct Answer:
Verified
Q58: The figure given below shows the demand
Q59: The table given below shows the price,
Q60: The figure given below shows the aggregate
Q61: The following table shows the units of
Q62: The figure given below shows the cost
Q64: The figure given below shows the cost
Q65: The following figure shows the revenue curves
Q66: The table given below shows the price,
Q67: The figure given below shows the cost
Q68: The figure given below shows the cost