Multiple Choice
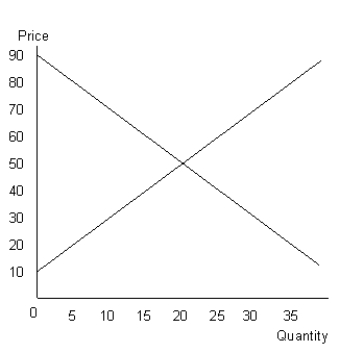
The figure given below shows the aggregate demand and supply curves of a perfectly competitive market.Figure 10.7

-Before World War II, Alcoa controlled the supply of bauxite in the United States. Because bauxite is a scarce resource that is vital to the production of aluminum:
A) Alcoa was bound to charge a nominal price in the U.S. aluminum market.
B) Alcoa had a monopoly in the U.S. aluminum market.
C) the U.S. aluminum market was highly competitive.
D) Alcoa can be said to have operated in a monopolistically competitive market.
E) Alcoa can be said to have operated in an oligopolistic market structure.
Correct Answer:

Verified
Correct Answer:
Verified
Q55: The following figure shows the revenue curves
Q56: The figure given below shows the cost
Q57: The table given below shows the price,
Q58: The figure given below shows the demand
Q59: The table given below shows the price,
Q61: The following table shows the units of
Q62: The figure given below shows the cost
Q63: The following figures show the demand and
Q64: The figure given below shows the cost
Q65: The following figure shows the revenue curves