Multiple Choice
The figure below shows the market equilibrium (point B) at the intersection of demand and supply curves under perfect competition.Figure 11.5
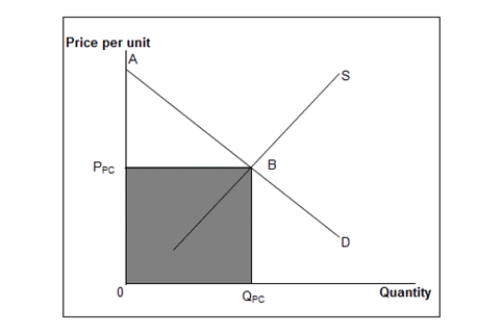 D: Market demand curve
S: Market supply curve
-The efficiency loss that occurs when a market is monopolized is known as:
A) a deadweight loss.
B) an inventory loss.
C) an economic loss.
D) a non-economic loss.
E) a capital loss.
Correct Answer:

Verified
Correct Answer:
Verified
Q9: The table given below shows the price,
Q10: The figure given below shows the aggregate
Q11: The figure given below shows the cost
Q12: The figure given below shows the aggregate
Q13: The figure given below shows the cost
Q15: The figure given below shows the cost
Q16: The following figures show the demand and
Q17: The figures given below represent the revenue
Q18: The following figures show the demand and
Q19: The figures given below represent the revenue