Multiple Choice
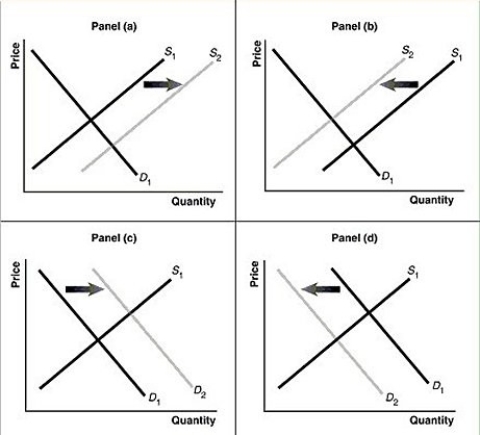
Figure 3-7

-Refer to Figure 3-7.Assume that the graphs in this figure represent the demand and supply curves for bicycle helmets.Which panel best describes what happens in this market if there is a substantial increase in the price of bicycles?
A) Panel (a)
B) Panel (b)
C) Panel (c)
D) Panel (d)
Correct Answer:

Verified
Correct Answer:
Verified
Q227: Which of the following would cause the
Q228: Figure 3-1<br> <img src="https://d2lvgg3v3hfg70.cloudfront.net/TB4193/.jpg" alt="Figure 3-1
Q229: A normal good is a good for
Q230: In 2004, hurricanes destroyed a large portion
Q231: A positive technological change will cause the
Q233: Figure 3-7<br> <img src="https://d2lvgg3v3hfg70.cloudfront.net/TB4193/.jpg" alt="Figure 3-7
Q234: Which of the following has occurred as
Q235: Which of the following is evidence of
Q236: An article in the Wall Street Journal
Q237: What is the law of supply? What