True/False
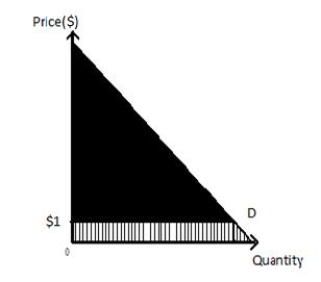
The following diagram shows the demand curve for medical benefits. A $1 payment for services would reduce consumer surplus, yet would still leave beneficiaries with a substantial consumer surplus.
Figure 6.9
Correct Answer:

Verified
Correct Answer:
Verified
Related Questions
Q34: Carvel advertises a football-shaped ice cream cake
Q60: The following graph shows the demand curves
Q61: The following diagram shows the demand curve
Q63: When this market is in equilibrium, the
Q66: Suppose the marginal utility of a unit
Q67: The following table shows the marginal utility
Q68: The following table shows the total utility
Q69: The following graph shows the total utility
Q97: Consumers derive consumer surplus when _<br>A)the monetary
Q161: Marginal utility can be objectively measured and