Multiple Choice
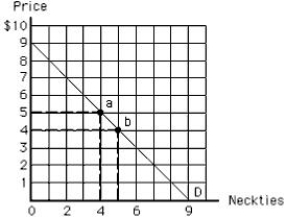
The following diagram shows the demand curve for neckties. At point a, the monetary value of the total utility received by a consumer is:
Figure 6.3
A) $5.
B) $9.
C) $20.
D) $26.
E) $45.
Correct Answer:

Verified
Correct Answer:
Verified
Related Questions
Q27: The consumption of goods and services has
Q34: Carvel advertises a football-shaped ice cream cake
Q57: Suppose the price of a glass of
Q60: The following graph shows the demand curves
Q63: When this market is in equilibrium, the
Q65: The following diagram shows the demand curve
Q66: Suppose the marginal utility of a unit
Q125: Joshua consumes pizza and cola in such
Q150: A business executive who buys a portable
Q161: Marginal utility can be objectively measured and