Multiple Choice
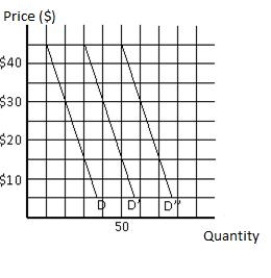
The following graph shows the demand curves for three consumers in the market, represented by D, D' and D''. At a price of $30, the market quantity demanded for the good will be _____ units.
Figure 6.10
A) 40
B) 60
C) 80
D) 100
E) 120
Correct Answer:

Verified
Correct Answer:
Verified
Related Questions
Q27: The consumption of goods and services has
Q34: Carvel advertises a football-shaped ice cream cake
Q57: Suppose the price of a glass of
Q61: The following diagram shows the demand curve
Q63: When this market is in equilibrium, the
Q65: The following diagram shows the demand curve
Q125: Joshua consumes pizza and cola in such
Q129: A utility-maximizing consumer equalizes marginal utilities across
Q150: A business executive who buys a portable
Q161: Marginal utility can be objectively measured and