menu-iconExamlexExamLexServices

Discover

Ask a Question
  1. All Topics
  2. Topic
    Business
  3. Study Set
    ECON MICRO Study Set 1
  4. Exam
    Exam 6: Consumer Choice and Demand
  5. Question
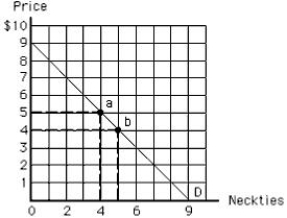
    The Following Image Shows the Demand Curve for Neckties
Solved

The Following Image Shows the Demand Curve for Neckties

Question 98

Question 98

Multiple Choice

The following image shows the demand curve for neckties. At point a, consumer surplus is _____. ​
Figure 6.3
​​
The following image shows the demand curve for neckties. At point a, consumer surplus is _____. ​ Figure 6.3 ​​   A) $0 B) $5 C) $8 D) $20 E) $26


A) $0
B) $5
C) $8
D) $20
E) $26

Correct Answer:

verifed

Verified

Unlock this answer now
Get Access to more Verified Answers free of charge

Related Questions

Q73: If Jennie spends her income on ice

Q93: The following diagram shows the demand curve

Q96: The following diagram shows the market demand

Q97: Elvis values the first gravy sandwich at

Q100: A free good will be consumed up

Q101: The cost of consumption has two components:<br>A)the

Q101: For any given price, the more elastic

Q102: Which of the following is true of

Q103: At a zero price, the consumer surplus

Q141: Annie reallocates her budget until the ratios

Examlex

ExamLex

About UsContact UsPerks CenterHomeschoolingTest Prep

Work With Us

Campus RepresentativeInfluencers

Links

FaqPricingChrome Extension

Download The App

Get App StoreGet Google Play

Policies

Privacy PolicyTerms of ServiceHonor CodeCommunity Guidelines

Scan To Download

qr-code

Copyright © (2025) ExamLex LLC.

Privacy PolicyTerms Of ServiceHonor CodeCommunity Guidelines