Multiple Choice
The following diagram shows the market demand schedule for a good. When the price of the good is P, the shaded area represents:
Figure 6.5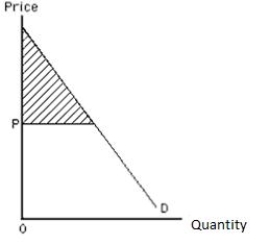
A) shortage.
B) marginal utility of the good.
C) price floor.
D) consumer surplus.
E) marginal valuation of the good.
Correct Answer:

Verified
Correct Answer:
Verified
Related Questions
Q73: If Jennie spends her income on ice
Q91: The following diagram shows the market equilibrium
Q93: The following diagram shows the demand curve
Q97: Elvis values the first gravy sandwich at
Q98: The following image shows the demand curve
Q100: A free good will be consumed up
Q101: The cost of consumption has two components:<br>A)the
Q101: For any given price, the more elastic
Q141: Annie reallocates her budget until the ratios
Q174: If a consumer buys a good,the expected