Multiple Choice
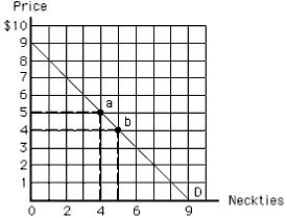
The following diagram shows the demand curve for neckties. At point a, total expenditure on neckties is:
Figure 6.3
A) $5.
B) $9.
C) $20.
D) $26.
E) $45.
Correct Answer:

Verified
Correct Answer:
Verified
Related Questions
Q91: The following diagram shows the market equilibrium
Q96: The following diagram shows the market demand
Q97: Elvis values the first gravy sandwich at
Q98: The following image shows the demand curve
Q101: The cost of consumption has two components:<br>A)the
Q114: A decrease in price along the elastic
Q121: The law of diminishing marginal utility explains
Q141: Annie reallocates her budget until the ratios
Q170: Fred truthfully tells a car dealer that
Q174: If a consumer buys a good,the expected