Multiple Choice
The following diagram shows the market equilibrium for opera tickets. The demand curve for opera tickets is labeled D and the supply curve S. At market equilibrium, area _____ represents the consumer surplus of all buyers in the market.
Figure 6.7
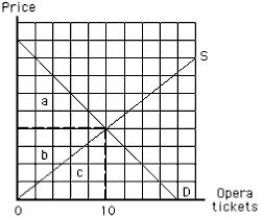
A) a
B) b
C) c
D) a + b + c
E) a + b
Correct Answer:

Verified
Correct Answer:
Verified
Q86: Mark's marginal utility of a third waffle
Q87: Total utility is the:<br>A)sum of all marginal
Q93: The following diagram shows the demand curve
Q96: The following diagram shows the market demand
Q101: The cost of consumption has two components:<br>A)the
Q114: A decrease in price along the elastic
Q121: The law of diminishing marginal utility explains
Q141: Annie reallocates her budget until the ratios
Q170: Fred truthfully tells a car dealer that
Q174: If a consumer buys a good,the expected