Multiple Choice
The following graph shows market equilibrium in the presence of an externality in an economy. The equilibrium level of output for the firm is _____.
Figure 17.1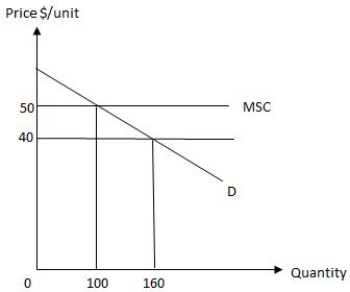
A) 0 units
B) 100 units
C) between 0 and 100 units
D) 160 units
E) between 100 and 160 units
Correct Answer:

Verified
Correct Answer:
Verified
Q53: An increase in the marginal cost of
Q111: Fishes in the ocean are:<br>A)exhaustible and also
Q113: The following graph shows equilibrium in a
Q114: A meditation class meets on the second
Q115: Imposition of tax on an open-access resource
Q117: The following graph shows equilibrium in a
Q119: When society receives more benefits from a
Q120: To maximize social welfare in the presence
Q123: Which of the following helps explain why
Q182: If producers cannot afford the fees for