Multiple Choice
The following graph shows equilibrium in a market in the presence of externality in an economy. The total social gain from producing the socially efficient output rather than the private equilibrium output is shown by the area ______.
Figure 17.2
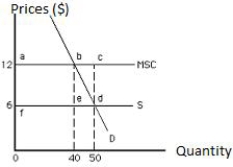
A) abdf
B) bed
C) bcd
D) acdf
E) bcde
Correct Answer:

Verified
Correct Answer:
Verified
Q53: An increase in the marginal cost of
Q113: The following graph shows equilibrium in a
Q114: A meditation class meets on the second
Q115: Imposition of tax on an open-access resource
Q116: The following graph shows market equilibrium in
Q119: When society receives more benefits from a
Q120: To maximize social welfare in the presence
Q122: Pollution arises because:<br>A)the atmosphere is a nonrenewable
Q123: Which of the following helps explain why
Q182: If producers cannot afford the fees for