Multiple Choice
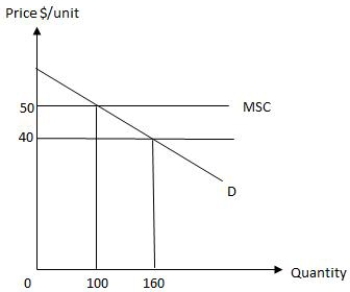
The following graph shows equilibrium in a market in the presence of an externality. The amount by which the total social cost of producing the private equilibrium level of output exceeds the total social benefit is _____.
Figure 17.1
A) $3,000
B) $1,000
C) $5,000
D) $1,600
E) $1,400
Correct Answer:

Verified
Correct Answer:
Verified
Q57: According to the Coase theorem,there will be
Q109: The following graph shows market equilibrium in
Q111: Fishes in the ocean are:<br>A)exhaustible and also
Q114: A meditation class meets on the second
Q115: Imposition of tax on an open-access resource
Q116: The following graph shows market equilibrium in
Q117: The following graph shows equilibrium in a
Q123: Which of the following helps explain why
Q179: Governments often subsidize activities that generate positive
Q182: If producers cannot afford the fees for