Multiple Choice
Figure 18-5 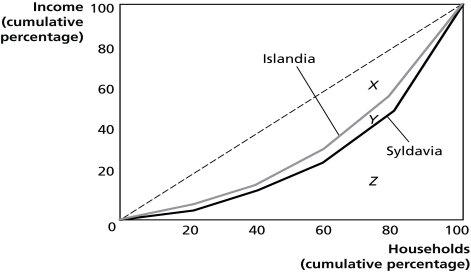
Figure 18-5 shows the Lorenz curves for Islandia and Syldavia.
-Refer to Figure 18-5.If area X = 2,060,area Y = 240,and area Z = 2,700,calculate the Gini coefficient for Islandia.
A) 0.41
B) 0.45
C) 0.70
D) 0.76
Correct Answer:

Verified
Correct Answer:
Verified
Q69: If the marginal tax rate is less
Q114: <img src="https://d2lvgg3v3hfg70.cloudfront.net/TB3018/.jpg" alt=" Figure 18-2 shows
Q134: Figure 18-6 <img src="https://d2lvgg3v3hfg70.cloudfront.net/TB4184/.jpg" alt="Figure 18-6
Q150: Consider the following methods of taxing a
Q180: If the Gini coefficient for Cartland is
Q196: If, as your taxable income decreases, you
Q198: The median voter model implies that<br>A)many people
Q210: A tax bracket is<br>A)the percent of taxable
Q234: <img src="https://d2lvgg3v3hfg70.cloudfront.net/TB3018/.jpg" alt=" Figure 18-2 shows
Q254: If you pay $2,000 in taxes on