Essay
Figure 18-6 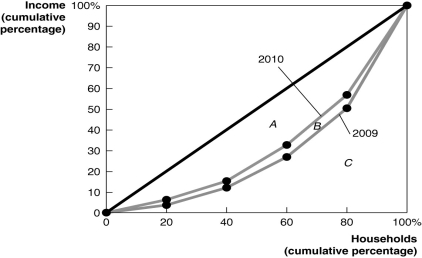
-Refer to Figure 18-6 to answer the following questions.
a.Did the distribution of income become more equal in 2010 that it was in 2009,or did it become less equal? Explain.
b.If area A = 1,600,area B = 200,and area C = 3,200,calculate the Gini coefficient for 2009 and the Gini coefficient for 2010.
Correct Answer:

Verified
a.The distribution of income became more...View Answer
Unlock this answer now
Get Access to more Verified Answers free of charge
Correct Answer:
Verified
View Answer
Unlock this answer now
Get Access to more Verified Answers free of charge
Q69: If the marginal tax rate is less
Q114: <img src="https://d2lvgg3v3hfg70.cloudfront.net/TB3018/.jpg" alt=" Figure 18-2 shows
Q132: Figure 18-5 <img src="https://d2lvgg3v3hfg70.cloudfront.net/TB4184/.jpg" alt="Figure 18-5
Q150: Consider the following methods of taxing a
Q180: If the Gini coefficient for Cartland is
Q196: If, as your taxable income decreases, you
Q198: The median voter model implies that<br>A)many people
Q210: A tax bracket is<br>A)the percent of taxable
Q234: <img src="https://d2lvgg3v3hfg70.cloudfront.net/TB3018/.jpg" alt=" Figure 18-2 shows
Q254: If you pay $2,000 in taxes on