Essay
Figure 18-3 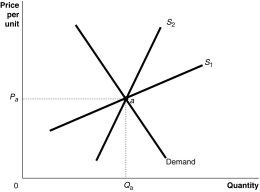
-Refer to Figure 18-3.The figure above shows a demand curve and two supply curves,one more elastic than the other.Use Figure 18-3 to answer the following questions.
a.Suppose the government imposes an excise tax of $1.00 on every unit sold.Use the graph to illustrate the impact of this tax.
b.If the government imposes an excise tax of $1.00 on every unit sold,will the consumer pay more of the tax if the supply curve is S1 or S2? Refer to the graphs in your answer.
c.If an excise tax of $1.00 on every unit sold is imposed,will the revenue collected by the government be greater if the supply curve is S1 or S2?
d.If the government imposes an excise tax of $1.00 on every unit sold,will the deadweight loss be greater if the supply curve is S1 or S2?
Correct Answer:

Verified
a.The supply curve shifts up by the full...View Answer
Unlock this answer now
Get Access to more Verified Answers free of charge
Correct Answer:
Verified
View Answer
Unlock this answer now
Get Access to more Verified Answers free of charge
Q37: Which of the following tax systems would
Q40: A marginal tax rate is calculated as<br>A)total
Q69: If the marginal tax rate is less
Q75: Table 18-9<br> <img src="https://d2lvgg3v3hfg70.cloudfront.net/TB4193/.jpg" alt="Table 18-9
Q80: Table 18-6<br> <img src="https://d2lvgg3v3hfg70.cloudfront.net/TB4193/.jpg" alt="Table 18-6
Q113: The corporate income tax is ultimately paid
Q143: The marginal tax rate is<br>A)the amount of
Q169: Table 18-8<br> <img src="https://d2lvgg3v3hfg70.cloudfront.net/TB4193/.jpg" alt="Table 18-8
Q219: Figure 18-1<br> <img src="https://d2lvgg3v3hfg70.cloudfront.net/TB4193/.jpg" alt="Figure 18-1
Q237: Article Summary<br>State tax revenue from marijuana sales