Multiple Choice
Figure 3-2 shows the shifts in the demand curve for a good. A change from Point A to Point B represents a(n) :Figure 3-2 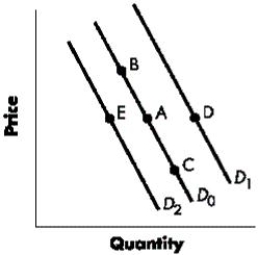
A) increase in demand.
B) decrease in demand.
C) decrease in quantity demanded.
D) increase in quantity demanded
E) decrease in the price of the good
Correct Answer:

Verified
Correct Answer:
Verified
Related Questions
Q2: When quantity demanded increases at every possible
Q3: What is the difference between a change
Q4: What is the most likely effect of
Q5: A decrease in demand for a good
Q6: Figure 3-2 shows the shifts in the
Q8: If watermelons are normal goods, the demand
Q9: Figure 3-4 represents the market for butter.
Q11: Figure 3-2 shows the shifts in the
Q16: Increasing government taxation or regulation of an
Q39: Two goods are complements if an increase