Multiple Choice
Use the following to answer questions:
Figure: Unemployment Rate over Time 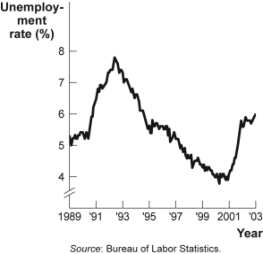
-(Figure: Unemployment Rate over Time) Look at the figure Unemployment Rate over Time. In the time-series graph, as we move from 1993 to 1995, we see that the unemployment rate has _____ from approximately _____ to approximately _____.
A) decreased; 5%; 4%
B) increased; 5.3%; 7.3%
C) decreased; 7%; 5.5%
D) increased; 4%; 6.3%
Correct Answer:

Verified
Correct Answer:
Verified
Q21: The fact that two variables always move
Q52: Use the following to answer questions :<br>Figure:
Q54: If two variables are negatively related, they
Q55: Use the following to answer questions :<br>Figure:
Q56: Use the following to answer questions :<br>Figure:
Q58: Use the following to answer questions :<br>Figure:
Q59: Use the following to answer questions :<br>Figure:
Q60: Use the following to answer questions:<br>Figure: Unemployment
Q61: In the graph of a curve, the
Q112: A town hires more police officers and