Multiple Choice
Use the following to answer questions :
Figure: Labor Force Participation Rate 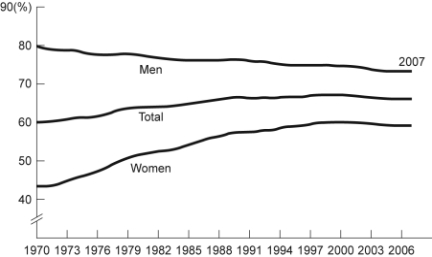
-(Figure: Labor Force Participation Rate) Look at the figure Labor Force Participation Rate. Using the figure, the labor force participation rate for women was ______ during 1970-1985 and ______ during 1998-2006.
A) increasing; slightly decreasing
B) increasing; increasing
C) decreasing; increasing
D) decreasing; constant
Correct Answer:

Verified
Correct Answer:
Verified
Q4: A pie chart is used to depict
Q21: The fact that two variables always move
Q47: Use the following to answer questions :<br>Figure:
Q48: Use the following to answer questions :<br>Figure:
Q50: Use the following to answer questions :<br>Figure:
Q51: Use the following to answer questions:<br>Figure: Unemployment
Q54: If two variables are negatively related, they
Q55: Use the following to answer questions :<br>Figure:
Q56: Use the following to answer questions :<br>Figure:
Q57: Use the following to answer questions:<br>Figure: Unemployment