Multiple Choice
Use the following to answer questions :
Figure: Seasonally Adjusted Unemployment Rate 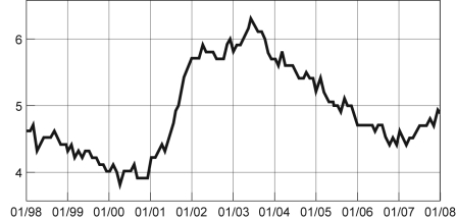
-(Figure: Seasonally Adjusted Unemployment Rate) Look at the figure Seasonally Adjusted Unemployment Rate. The distance between each labeled point on the horizontal axis is one year. Unemployment was ______ between 1/2001 and 1/2002 and ______ between 1/1999 and 1/2000.
A) increasing; decreasing
B) increasing; increasing
C) decreasing; increasing
D) decreasing; decreasing
Correct Answer:

Verified
Correct Answer:
Verified
Q21: The fact that two variables always move
Q50: Use the following to answer questions :<br>Figure:
Q51: Use the following to answer questions:<br>Figure: Unemployment
Q52: Use the following to answer questions :<br>Figure:
Q54: If two variables are negatively related, they
Q56: Use the following to answer questions :<br>Figure:
Q57: Use the following to answer questions:<br>Figure: Unemployment
Q58: Use the following to answer questions :<br>Figure:
Q59: Use the following to answer questions :<br>Figure:
Q60: Use the following to answer questions:<br>Figure: Unemployment