True/False
Use the following to answer questions :
Figure: Consumption of Pizza and Tacos 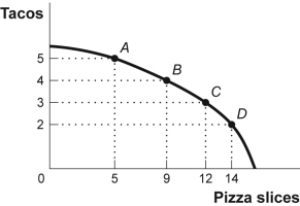
-(Figure: Consumption of Pizza and Tacos) Look at the figure Consumption of Pizza and Tacos. The figure shows the number of tacos and pizza slices Matt can eat in a day. The relation is nonlinear, and there is a negative relation between the number of tacos and pizza slices that Matt can eat in a day.
Correct Answer:

Verified
Correct Answer:
Verified
Q4: A pie chart is used to depict
Q21: The fact that two variables always move
Q43: Use the following to answer questions :<br>Figure:
Q44: Use the following to answer questions :<br>Table:
Q45: Use the following to answer questions :<br>Figure:
Q46: The owner of the Dismal Philosopher, one
Q47: Use the following to answer questions :<br>Figure:
Q50: Use the following to answer questions :<br>Figure:
Q51: Use the following to answer questions:<br>Figure: Unemployment
Q52: Use the following to answer questions :<br>Figure: