Multiple Choice
Use the following to answer questions :
Figure: Demand and Supply 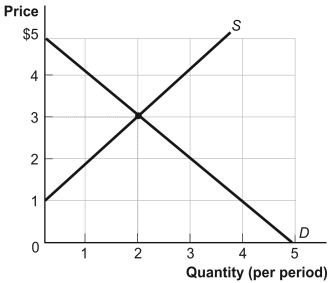
-(Figure: Demand and Supply) Look at the figure Demand and Supply. The curve labeled D indicates that a price of $2 is related to a quantity of:
A) 0
B) 1
C) 2
D) 3.
Correct Answer:

Verified
Correct Answer:
Verified
Q4: A pie chart is used to depict
Q21: The fact that two variables always move
Q45: Use the following to answer questions :<br>Figure:
Q46: The owner of the Dismal Philosopher, one
Q47: Use the following to answer questions :<br>Figure:
Q48: Use the following to answer questions :<br>Figure:
Q51: Use the following to answer questions:<br>Figure: Unemployment
Q52: Use the following to answer questions :<br>Figure:
Q54: If two variables are negatively related, they
Q55: Use the following to answer questions :<br>Figure: