Multiple Choice
Use the following to answer questions: 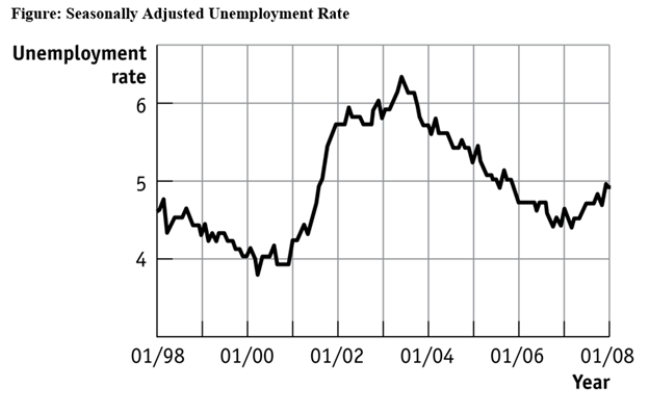
-(Figure: Seasonally Adjusted Unemployment Rate) Use Figure: Seasonally Adjusted Unemployment Rate.The distance between each labeled point on the horizontal axis is 1 year,and the distance between each labeled point on the vertical axis is 1 percentage point of unemployment.What is the approximate slope of the graph between 1/2001 and 1/2003 (using percentage point and years as the units on the vertical and horizontal axes,respectively) ?
A) 2
B) 1
C) -1
D) -2
Correct Answer:

Verified
Correct Answer:
Verified
Q11: Use the following to answer question:<br><img src="https://d2lvgg3v3hfg70.cloudfront.net/TB6643/.jpg"
Q22: The relation between two variables that move
Q30: Use the following to answer question: <img
Q35: Use the following to answer question:<br><img src="https://d2lvgg3v3hfg70.cloudfront.net/TB6643/.jpg"
Q36: The owner of the Dismal Philosopher,one of
Q40: Use the following to answer question: <img
Q43: Use the following to answer question 19:
Q48: A bar graph:<br>A)is useful when showing what
Q57: Use the following to answer question:<br><img src="https://d2lvgg3v3hfg70.cloudfront.net/TB6643/.jpg"
Q60: Use the following to answer question: <img