Multiple Choice
Figure 2-17 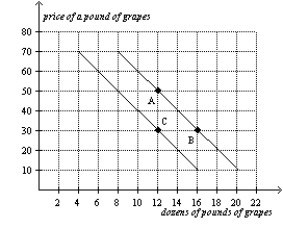
-Refer to Figure 2-17.The movement from point B to point C is a(n)
A) shift of the demand curve.
B) movement along the demand curve.
C) indication that the price of grapes has changed.
D) indication that the costs incurred by firms that produce grapes have changed.
Correct Answer:

Verified
Correct Answer:
Verified
Q3: Figure 2-18<br>Relationship between Price and Restaurant Meals
Q4: When two variables move in opposite directions,the
Q5: When two variables have a negative correlation
Q6: In the ordered pair (5,3),3 is the<br>A)horizontal
Q7: Eva wants to create a graph containing
Q9: Figure 2-17 <img src="https://d2lvgg3v3hfg70.cloudfront.net/TB2297/.jpg" alt="Figure 2-17
Q10: Suppose price is measured along the vertical
Q11: Figure 2-17 <img src="https://d2lvgg3v3hfg70.cloudfront.net/TB2297/.jpg" alt="Figure 2-17
Q13: When two variables have a negative correlation,<br>A)when
Q226: The x-coordinate of an ordered pair specifies