Multiple Choice
Figure 2-18
Relationship between Price and Restaurant Meals 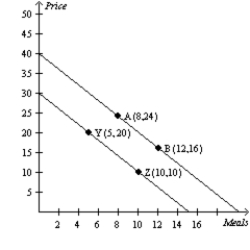
-Refer to Figure 2-18.A movement from point A to point Z is called
A) a shift in demand.
B) a movement along the demand curve.
C) a shift in supply.
D) a movement along the supply curve.
Correct Answer:

Verified
Correct Answer:
Verified
Q1: When two variables have a negative correlation,<br>A)they
Q2: Figure 2-18<br>Relationship between Price and Restaurant Meals
Q4: When two variables move in opposite directions,the
Q5: When two variables have a negative correlation
Q6: In the ordered pair (5,3),3 is the<br>A)horizontal
Q7: Eva wants to create a graph containing
Q8: Figure 2-17 <img src="https://d2lvgg3v3hfg70.cloudfront.net/TB2297/.jpg" alt="Figure 2-17
Q9: Figure 2-17 <img src="https://d2lvgg3v3hfg70.cloudfront.net/TB2297/.jpg" alt="Figure 2-17
Q10: Suppose price is measured along the vertical
Q11: Figure 2-17 <img src="https://d2lvgg3v3hfg70.cloudfront.net/TB2297/.jpg" alt="Figure 2-17