Multiple Choice
Use the following to answer question: 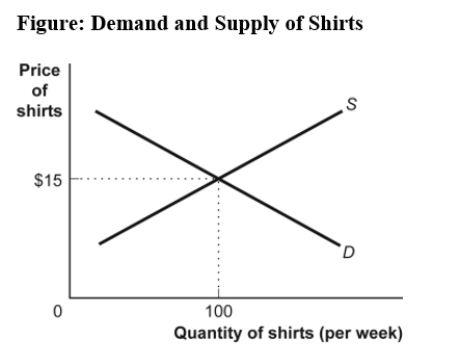
-(Figure: Demand and Supply of Shirts) Use Figure: Demand and Supply of Shirts.In the graph,if the line labeled D shows how many shirts per week will be demanded at various prices,then it is clear that,as the price of shirts falls:
A) fewer shirts will be demanded.
B) more shirts will be demanded.
C) the same quantity of shirts will be demanded.
D) it is unclear what will happen to the quantity of shirts demanded.
Correct Answer:

Verified
Correct Answer:
Verified
Q5: If two variables are positively related,on a
Q6: The point at which the axes of
Q7: The _ of a curve shows the
Q8: In a time-series graph,large changes can be
Q9: Use the following to answer question: <img
Q11: Use the following to answer question:<br><img src="https://d2lvgg3v3hfg70.cloudfront.net/TB6643/.jpg"
Q12: Use the following to answer question: <img
Q13: Professor Macro wants to use a numerical
Q14: Use the following to answer question: <img
Q15: In the graph of a curve,the vertical