Multiple Choice
A college admissions officer in the U.S.A.,defending the college's use of SAT scores in the admissions process,produced the graph below.It represents the mean GPAs for last year's freshmen,grouped by SAT scores.It shows that increased SAT score is associated with increased GPA.What concerns you about the graph,the statistical methodology,or the conclusion reached? 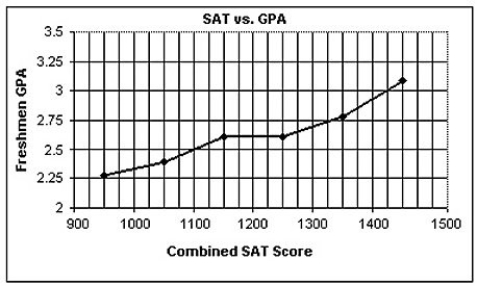
A) The statistical methodology is a concern because SAT is not an adequate predictor of GPA on average.
B) The conclusion reached is a concern because it should be increased GPA is associated with increased SAT score.
C) The conclusion reached is a concern because there are no relationships between SAT scores and GPA.
D) The statistical methodology is a concern because there may be lurking variables.
E) The statistical methodology is a concern because the GPA data is based on mean GPAs,not individual data.We also don't know the number of students in each SAT category.
Correct Answer:

Verified
Correct Answer:
Verified
Q1: A reporter studied the causes of
Q2: Which of the following scatterplots of residuals
Q3: The figure below shows the life
Q4: A study of consumer behavior finds a
Q6: The scatterplot below displays the yearly production
Q7: Which of the labeled points below are
Q8: The data in the table below
Q9: A study finds a strong positive association
Q10: The figure below shows the recent
Q11: The table below shows the age