Multiple Choice
The histogram shows the sizes (in acres) of 169 farms in Ontario.In addition to describing the distribution,approximate the percentage of farms that are under 100 acres. 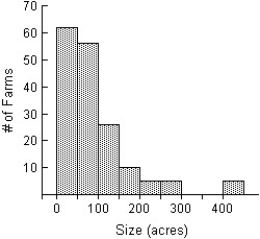
A) The distribution of the size of farms in Ontario is skewed to the right.Most of the farms are smaller than 150 acres,with some larger ones,from 150 to 300 acres.Five farms were larger than the rest,over 400 acres.The mode of the distribution is between 0 and 50 acres.It appears that 118 of 169 farms are under 100 acres,approximately 70%.
B) The distribution of the size of farms in Ontario is symmetric,with farm sizes ranging from 0 to 450 acres.The mode of the distribution is between 0 and 50 acres.It appears that 118 of 169 farms are under 100 acres,approximately 70%.
C) The distribution of the size of farms in Ontario is symmetric,with farm sizes ranging from 0 to 450 acres.The mode of the distribution is between 100 and 150 acres.It appears that 118 of 169 farms are under 100 acres,approximately 70%.
D) The distribution of the size of farms in Ontario is skewed to the right.Most of the farms are smaller than 50 acres,with some larger ones,from 150 to 300 acres.Five farms were larger than the rest,over 400 acres.The mode of the distribution is between 0 and 50 acres.It appears that 118 of 169 farms are under 100 acres,approximately 70%.
E) The distribution of the size of farms in Ontario is skewed to the right.Most of the farms are smaller than 150 acres,with some larger ones,from 150 to 300 acres.Five farms were larger than the rest,over 400 acres.The mode of the distribution is between 0 and 50 acres.It appears that 62 of 169 farms are under 100 acres,approximately 37%.
Correct Answer:

Verified
Correct Answer:
Verified
Q56: Which set has the largest standard
Q57: Number of times each face of a
Q58: The ages of the 21 members of
Q59: The heights,in centimetres,of 18 randomly selected
Q60: The normal annual precipitation (in millimetres)is given
Q62: Last weekend police ticketed 18 men whose
Q63: Here are some summary statistics for
Q64: Here are some summary statistics for
Q65: Shown below are the boxplot and the
Q66: The weights (in pounds)of 30 newborn