Multiple Choice
Shown below are the boxplot and the histogram for the weights (in pounds) of 30 newborn babies in Edmonton,Alberta in May,2014. 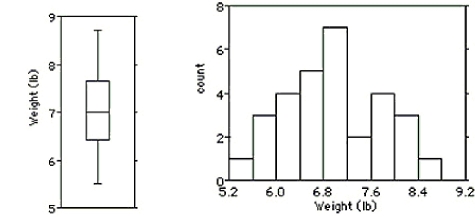
i) What features of the distribution can you see in both the histogram and the boxplot?
ii) What features of the distribution can you see in the histogram that you could not see in the boxplot?
A) i) The distribution is bimodal and symmetric.There are two outliers at about 5.4 and 8.6.The mean and median values are about the same. ii) The dip at about 7.4 lb,for example,is apparent only from the histogram.
B) i) The distribution is unimodal and skewed to the right.There are no outliers.The mean is greater than the median. ii) The dip at about 7.4 lb,for example,is apparent only from the histogram.
C) i) The distribution is unimodal and symmetric.There are two outliers at about 5.4 and 8.6.The mean and median values are about the same. ii) The dip at about 7.4 lb,for example,is apparent only from the histogram.
D) i) The distribution is unimodal and skewed to the left.There are no outliers.The mean is less than the median. ii) The dip at about 7.4 lb,for example,is apparent only from the histogram.
E) i) The distribution is unimodal and symmetric.There are no outliers.The mean and median values are about the same. ii) The dip at about 7.4 lb,for example,is apparent only from the histogram.
Correct Answer:

Verified
Correct Answer:
Verified
Q60: The normal annual precipitation (in millimetres)is given
Q61: The histogram shows the sizes (in acres)of
Q62: Last weekend police ticketed 18 men whose
Q63: Here are some summary statistics for
Q64: Here are some summary statistics for
Q66: The weights (in pounds)of 30 newborn
Q67: The back-to-back dotplot shows the number of
Q68: The speed vehicles travelled on a local
Q69: The test scores of 19 students are
Q70: A weight-loss company used the following histogram