Multiple Choice
The weights (in pounds) of 30 newborn babies are listed below.
Choose the boxplot that represents the given data.
I 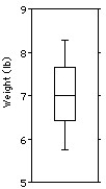
II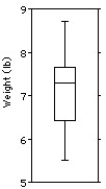
III 
IV 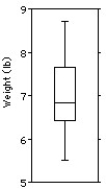
V 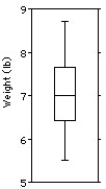
A) I
B) II
C) III
D) IV
E) V
Correct Answer:

Verified
Correct Answer:
Verified
Related Questions
Q61: The histogram shows the sizes (in acres)of
Q62: Last weekend police ticketed 18 men whose
Q63: Here are some summary statistics for
Q64: Here are some summary statistics for
Q65: Shown below are the boxplot and the
Q67: The back-to-back dotplot shows the number of
Q68: The speed vehicles travelled on a local
Q69: The test scores of 19 students are
Q70: A weight-loss company used the following histogram
Q71: Shown below are the boxplot,the histogram