Multiple Choice
The normal monthly precipitation (in inches) for August is listed for 20 different cities in Canada.
Choose the boxplot that represents the given data.
I 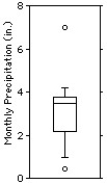
II 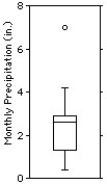
III
IV 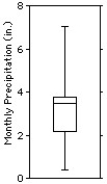
V 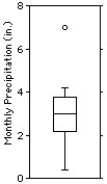
A) I
B) II
C) III
D) IV
E) V
Correct Answer:

Verified
Correct Answer:
Verified
Related Questions
Q9: The histograms show the cost of living,in
Q10: A local ice cream shop hand scoops
Q11: Here is an ogive of the distribution
Q12: Here are summary statistics for the
Q13: Here are the grocery bills,in dollars,for
Q15: The frequency table shows the weight,in
Q16: A small company employs a supervisor at
Q17: The histogram shows the lengths of hospital
Q18: The weights,in kilograms,of 18 randomly selected adults
Q19: Office workers were asked how long