Multiple Choice
The histograms show the cost of living,in dollars,for 32 U.S.cities.The histogram on the left shows the cost of living for the 32 cities using bins $10 wide,and the histogram on the right displays the same data using bins that are $6 wide.For which of the histograms would you most strenuously insist on using an IQR rather than a standard deviation to summarize spread? Explain. 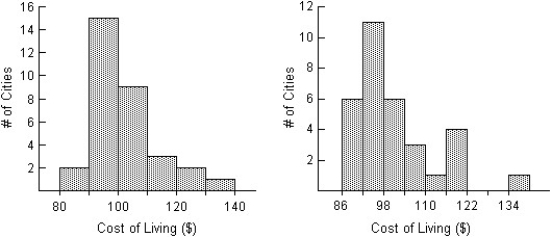
A) The histogram on the right is most nearly symmetric and shows no outliers.That makes it the best candidate for summarizing with an IQR.
B) The histogram on the left shows a low outlier.The standard deviation is sensitive to outliers,so we'd prefer to use the IQR for this one.
C) The histogram on the right shows a high outlier.The standard deviation is sensitive to outliers,so we'd prefer to use the IQR for this one.
D) The histogram on the left is most strongly skewed to the right.That makes it the best candidate for summarizing with an IQR.
E) The histogram on the left is most nearly symmetric and shows no outliers.That makes it the best candidate for summarizing with an IQR.
Correct Answer:

Verified
Correct Answer:
Verified
Q4: During student-teacher negotiations at a certain high
Q5: Shown below are the boxplot,the histogram
Q6: The test scores of 15 students
Q7: The mathematics department at a Canadian
Q8: A business owner recorded her annual
Q10: A local ice cream shop hand scoops
Q11: Here is an ogive of the distribution
Q12: Here are summary statistics for the
Q13: Here are the grocery bills,in dollars,for
Q14: The normal monthly precipitation (in inches)for