Multiple Choice
Here is an ogive of the distribution of students' marks on their statistics test. 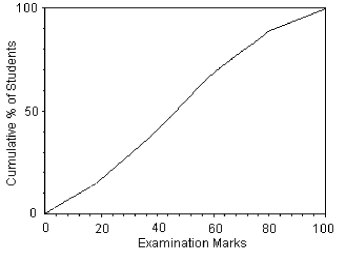 Choose the boxplot that represents the given data.
I 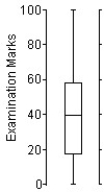
II 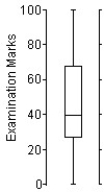
III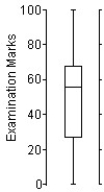
IV 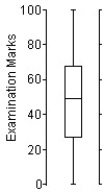
V 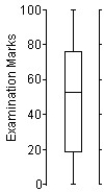
A) I
B) II
C) III
D) IV
E) V
Correct Answer:

Verified
Correct Answer:
Verified
Related Questions
Q6: The test scores of 15 students
Q7: The mathematics department at a Canadian
Q8: A business owner recorded her annual
Q9: The histograms show the cost of living,in
Q10: A local ice cream shop hand scoops
Q12: Here are summary statistics for the
Q13: Here are the grocery bills,in dollars,for
Q14: The normal monthly precipitation (in inches)for
Q15: The frequency table shows the weight,in
Q16: A small company employs a supervisor at