Multiple Choice
Shown below are the boxplot,the histogram and summary statistics for the weights (in pounds) of 30 newborn babies: 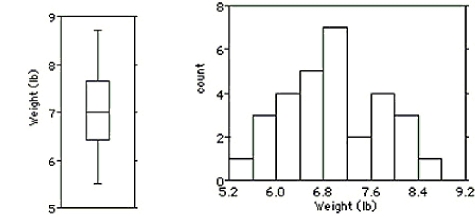 Write a few sentences describing the distribution.
A) The distribution is unimodal and symmetric.There are no outliers.The mean newborn baby weight was with a standard deviation of 0.8 lb.
B) The distribution is unimodal and symmetric.There are no outliers.The mean newborn baby weight was with a standard deviation of 1.3 lb.
C) The distribution is unimodal and skewed to the right.There are no outliers.The mean newborn baby weight was with an IQR of 1.3 lb.
D) The distribution is bimodal and symmetric.There are no outliers.The mean newborn baby weight was with a standard deviation of 0.8 lb.
E) The distribution is unimodal and skewed to the left.There are no outliers.The mean newborn baby weight was with an IQR of 1.3 lb.
Correct Answer:

Verified
Correct Answer:
Verified
Q66: The weights (in pounds)of 30 newborn
Q67: The back-to-back dotplot shows the number of
Q68: The speed vehicles travelled on a local
Q69: The test scores of 19 students are
Q70: A weight-loss company used the following histogram
Q72: Here is the stem-and-leaf display of
Q73: The stem-and-leaf diagram shows the ages
Q74: Heights of a group of male professional
Q75: The students in a math class took
Q76: The free throw percentages for the participants