Multiple Choice
The back-to-back dotplot shows the number of fatalities per year caused by tornadoes in a certain state for two periods: 1950-1974 and 1975-1999.Explain how you would summarize the centre and spread of each of the variables depicted in the dotplots. 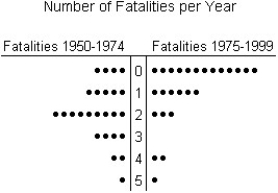
A) The distribution of the number of fatalities per year for the period 1950-1974 is unimodal and approximately symmetric.Therefore,we would be satisfied using the mean to summarize the centre and the standard deviation to summarize spread.For the period 1975-1999,the distribution of the number of fatalities per year is also unimodal,but skewed to the right.Therefore,we would prefer to use a median for centre and an IQR to summarize spread.
B) The distribution of the number of fatalities per year for the period 1950-1974 is unimodal,but skewed to the right.Therefore,we would prefer to use a median for centre and an IQR to summarize spread.For the period 1975-1999,the distribution is also unimodal and approximately symmetric.Therefore,we would be satisfied using the mean to summarize the centre and the standard deviation to summarize spread.
C) The distribution of the number of fatalities per year for the period 1950-1974 is bimodal.Therefore,we would prefer to use a median to summarize the centre and an IQR to summarize spread.For the period 1975-1999,the distribution of the number of fatalities per year is also bimodal,but skewed to the left.Therefore,we would prefer to use a mean for centre and a standard deviation to summarize spread.
D) The distribution of the number of fatalities per year for the period 1950-1974 is unimodal and approximately symmetric.Therefore,we would prefer to use the median to summarize the centre and the standard deviation to summarize spread.For the period 1975-1999,the distribution of the number of fatalities per year is also unimodal,but skewed to the right.Therefore,we would prefer to use the mean for centre and an IQR to summarize spread.
E) The distribution of the number of fatalities per year for the period 1950-1974 is unimodal but skewed to the right.Therefore,we would prefer to use a median to summarize the centre and IQR to summarize spread.For the period 1975-1999,the distribution of the number of fatalities per year is also unimodal and skewed to the right.Therefore,we would prefer to use a median for centre and an IQR to summarize spread.
Correct Answer:

Verified
Correct Answer:
Verified
Q62: Last weekend police ticketed 18 men whose
Q63: Here are some summary statistics for
Q64: Here are some summary statistics for
Q65: Shown below are the boxplot and the
Q66: The weights (in pounds)of 30 newborn
Q68: The speed vehicles travelled on a local
Q69: The test scores of 19 students are
Q70: A weight-loss company used the following histogram
Q71: Shown below are the boxplot,the histogram
Q72: Here is the stem-and-leaf display of