Multiple Choice
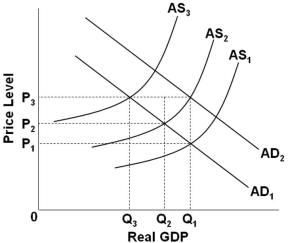 Refer to the graph above. Suppose that the economy is at an initial equilibrium where the AD1 and AS1 curves intersect. Demand-pull inflation in the long run can best be illustrated as a shift of:
A) AS1 to AS2, and back again to AS1
B) AD1 to AD2, and back again to AD1
C) AS1 to AS2, consequently making AD1 shift to AD2
D) AD1 to AD2, consequently making AS1 shift to AS2
Correct Answer:

Verified
Correct Answer:
Verified
Q50: Demand-pull inflation in the short-run raises the
Q51: Assume that a person earns $600 per
Q52: A potential cause of stagflation is:<br>A) Agricultural
Q53: <img src="https://d2lvgg3v3hfg70.cloudfront.net/TB4895/.jpg" alt=" Refer to the
Q54: Which event probably contributed to the stagflation
Q56: In the short run, the price level
Q57: <img src="https://d2lvgg3v3hfg70.cloudfront.net/TB4895/.jpg" alt=" Refer to the
Q58: <img src="https://d2lvgg3v3hfg70.cloudfront.net/TB4895/.jpg" alt=" Refer to the
Q59: <img src="https://d2lvgg3v3hfg70.cloudfront.net/TB4895/.jpg" alt=" The graph above
Q60: Based on the Laffer Curve, a cut