Multiple Choice
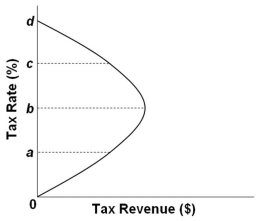 The graph above describes the notion that as tax rates rise from zero percent, tax revenues will:
A) Increase at first, but then decline eventually as tax rate continues rising
B) Decrease at first, but then increase eventually as tax rate continues rising
C) Rise higher and higher
D) Fall lower and lower until it shrinks to zero
Correct Answer:

Verified
Correct Answer:
Verified
Q54: Which event probably contributed to the stagflation
Q55: <img src="https://d2lvgg3v3hfg70.cloudfront.net/TB4895/.jpg" alt=" Refer to the
Q56: In the short run, the price level
Q57: <img src="https://d2lvgg3v3hfg70.cloudfront.net/TB4895/.jpg" alt=" Refer to the
Q58: <img src="https://d2lvgg3v3hfg70.cloudfront.net/TB4895/.jpg" alt=" Refer to the
Q60: Based on the Laffer Curve, a cut
Q61: One central idea in supply-side economics concerning
Q62: The long-run Phillips Curve is vertical at:<br>A)
Q63: A rightward shift of the Phillips Curve
Q119: In the context of the Phillips curve,