Multiple Choice
 Refer to the graph above. Economic growth driven by productivity and technology would be illustrated as a shift of:
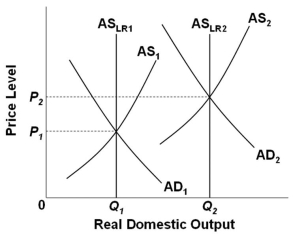
A) AD1 to AD2
B) P1 to P2
C) AS2 to AS1
D) ASLR1 to ASLR2
Correct Answer:

Verified
Correct Answer:
Verified
Q52: A potential cause of stagflation is:<br>A) Agricultural
Q53: <img src="https://d2lvgg3v3hfg70.cloudfront.net/TB4895/.jpg" alt=" Refer to the
Q54: Which event probably contributed to the stagflation
Q55: <img src="https://d2lvgg3v3hfg70.cloudfront.net/TB4895/.jpg" alt=" Refer to the
Q56: In the short run, the price level
Q58: <img src="https://d2lvgg3v3hfg70.cloudfront.net/TB4895/.jpg" alt=" Refer to the
Q59: <img src="https://d2lvgg3v3hfg70.cloudfront.net/TB4895/.jpg" alt=" The graph above
Q60: Based on the Laffer Curve, a cut
Q61: One central idea in supply-side economics concerning
Q62: The long-run Phillips Curve is vertical at:<br>A)