Multiple Choice
Exhibit 18.3.The following table shows the annual revenues (in millions of dollars) of a pharmaceutical company over the period 1990-2011. 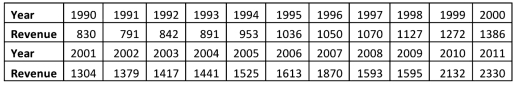
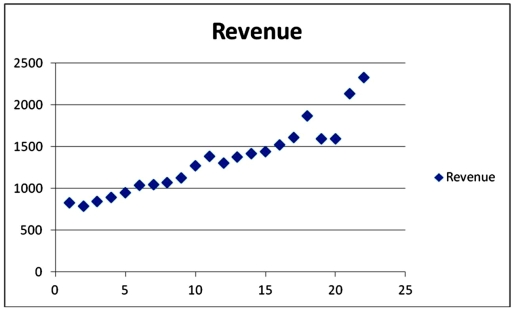 Excel scatterplot shown above indicates that the annual revenues have an increasing trend.Therefore,linear,exponential,quadratic and cubic models were used to fit the trend,and the following relevant information became available after applying linear regression.
 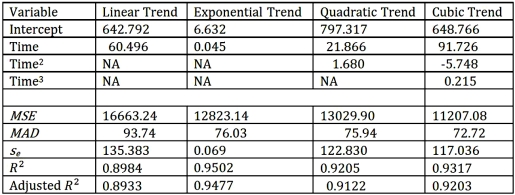 Refer to Exhibit 18.3.What is an exponential trend equation?
A) 
B) 
C) 
D) 
Correct Answer:

Verified
Correct Answer:
Verified
Q14: Exhibit 18.3.The following table shows the annual
Q16: Which of the following types of trend
Q17: Exhibit 18.8.Quarterly sales of a department store
Q20: Which of the following is a criticism
Q21: Exhibit 18.3.The following table shows the annual
Q22: Exhibit 18.3.The following table shows the annual
Q23: Exhibit 18.7.The following table shows the annual
Q24: If T denotes the number of observations,which
Q90: Quantitative forecasting procedures are based on the
Q118: In the time series decomposition method, to