Multiple Choice
Exhibit 18.3.The following table shows the annual revenues (in millions of dollars) of a pharmaceutical company over the period 1990-2011. 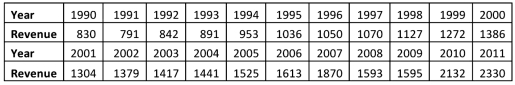
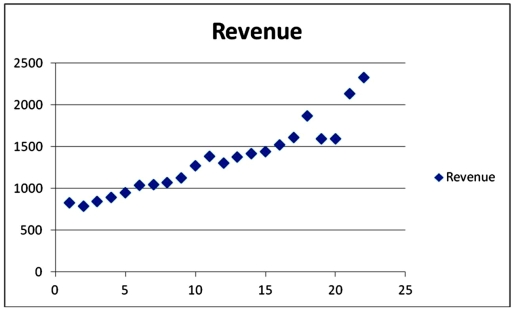 Excel scatterplot shown above indicates that the annual revenues have an increasing trend.Therefore,linear,exponential,quadratic and cubic models were used to fit the trend,and the following relevant information became available after applying linear regression.
 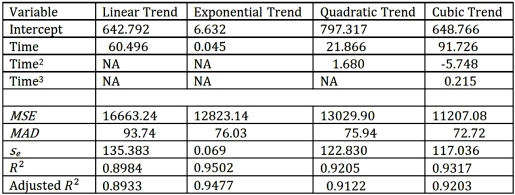 Refer to Exhibit 18.3.What is the revenue forecast for 2013 found by the trend regression equation with the best fit?
A) About 2 billion and 512 million dollars
B) About 2 billion and 95 million dollars
C) About 2 billion and 248 million dollars
D) About 2 billion and 290 million dollars
Correct Answer:

Verified
Correct Answer:
Verified
Q17: Exhibit 18.8.Quarterly sales of a department store
Q19: Exhibit 18.3.The following table shows the annual
Q20: Which of the following is a criticism
Q21: Exhibit 18.3.The following table shows the annual
Q23: Exhibit 18.7.The following table shows the annual
Q24: If T denotes the number of observations,which
Q25: Exhibit 18.1.The past monthly demands are shown
Q26: Exhibit 18.3.The following table shows the annual
Q27: Exhibit 18.4.The following ratio-to-moving averages for the
Q118: In the time series decomposition method, to