Essay
Exhibit 18.8.Quarterly sales of a department store for the last 7 years are given in the following table. 
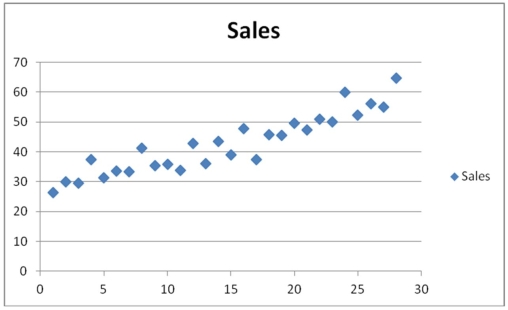 The Excel scatterplot shown above indicates that the quarterly sales have an increasing trend and seasonality.Therefore,the linear regression model,Sales = β0 + β1Qtr1 + β2Qtr2 + β3Qtr3 + β4t + ε with three seasonal dummy variables Qtr1,Qtr2 and Qtr3,and the decomposition method are proposed to make sales forecasts.For the regression model,the following Excel partial output is available.
 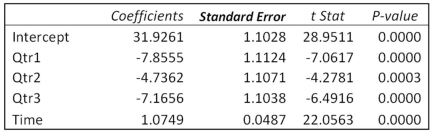 Refer to Exhibit 18.8.(Use Excel. )Using MSE and MAD,compare the linear trend equation with seasonal dummy variables,
  ,
,
and the decomposition method equation, 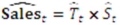 with
with 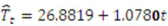 and the quarterly seasonal indices: 0.9322,1.0066,0.9441,and 1.1171.Which of the two corresponding forecasting models is recommended?
Correct Answer:

Verified
MSE = 3.50 and MAD = 1.53 for ...View Answer
Unlock this answer now
Get Access to more Verified Answers free of charge
Correct Answer:
Verified
View Answer
Unlock this answer now
Get Access to more Verified Answers free of charge
Q12: Exhibit 18.2.The following table includes the information
Q13: Exhibit 18.8.Quarterly sales of a department store
Q14: Exhibit 18.3.The following table shows the annual
Q16: Which of the following types of trend
Q19: Exhibit 18.3.The following table shows the annual
Q20: Which of the following is a criticism
Q21: Exhibit 18.3.The following table shows the annual
Q22: Exhibit 18.3.The following table shows the annual
Q90: Quantitative forecasting procedures are based on the
Q118: In the time series decomposition method, to