Multiple Choice
Exhibit 16.2.Typically,the sales volume declines with an increase of a product price.It has been observed,however,that for some luxury goods the sales volume may increase when the price increases.The following Excel output illustrates this rather unusual relationship. 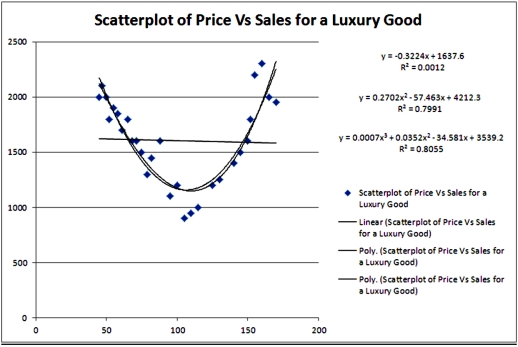 Refer to Exhibit 16.2.Which of the following models is most likely to be chosen in order to describe the relationship between Price and Sales?
A) Linear
B) Quadratic
C) Cubic
D) Exponential
Correct Answer:

Verified
Correct Answer:
Verified
Q85: Exhibit 16.2.Typically,the sales volume declines with an
Q86: The curve representing the regression equation <img
Q87: Exhibit 16.2.Typically,the sales volume declines with an
Q88: Exhibit 16-4.The following data shows the cooling
Q89: The fit of the regression equations <img
Q91: Exhibit 16.6.Thirty employed single individuals were randomly
Q92: The linear and logarithmic models,y = β<sub>0</sub>
Q93: For the logarithmic model y = β<sub>0</sub>
Q95: Exhibit 16.6.Thirty employed single individuals were randomly
Q99: What does a positive value for price