Short Answer
Exhibit 16.6.Thirty employed single individuals were randomly selected to examine the relationship between their age (Age)and their credit card debt (Debt)expressed as a percentage of their annual income.Three polynomial models were applied and the following table summarizes Excel's regression results. 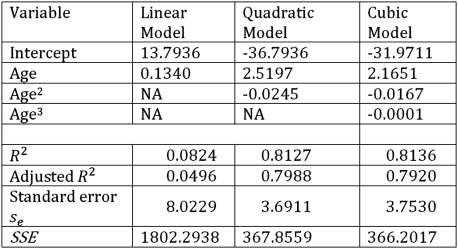 Refer to Exhibit 16.6.What is the predicted percentage debt of a 45 year old employed single person determined by the model with the best fit?
Correct Answer:

Verified
Correct Answer:
Verified
Q85: Exhibit 16.2.Typically,the sales volume declines with an
Q86: The curve representing the regression equation <img
Q87: Exhibit 16.2.Typically,the sales volume declines with an
Q88: Exhibit 16-4.The following data shows the cooling
Q89: The fit of the regression equations <img
Q90: Exhibit 16.2.Typically,the sales volume declines with an
Q91: Exhibit 16.6.Thirty employed single individuals were randomly
Q92: The linear and logarithmic models,y = β<sub>0</sub>
Q93: For the logarithmic model y = β<sub>0</sub>
Q99: What does a positive value for price