Multiple Choice
Exhibit 2-1.An auto parts chain asked customers to complete a survey rating the chain's customer service as average,above average,or below average.The following shows the results from the survey: 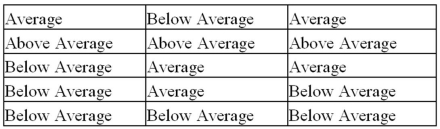 Refer to Exhibit 2-1.The proportion of customers that felt the customer service was average is closest to ______.
A) 0.20
B) 0.33
C) 0.46
D) 0.53
Correct Answer:

Verified
Correct Answer:
Verified
Q89: Construct a stem-and-leaf diagram with the following
Q90: Exhibit 2-9.An analyst constructed the following frequency
Q91: Exhibit 2-14.In the accompanying stem-and-leaf diagram,the values
Q92: Exhibit 2-10.Automobiles traveling on a road with
Q93: Exhibit 2-3.A city in California spent six
Q94: Exhibit 2-7.Thirty students at Eastside High School
Q95: When constructing a frequency distribution for quantitative
Q96: The accompanying cumulative relative frequency distribution shows
Q98: Exhibit 2-13.The organization of the Girl Sprouts
Q99: Use the following data to construct a