Multiple Choice
Exhibit 2-9.An analyst constructed the following frequency distribution on the monthly returns for 50 selected stocks: 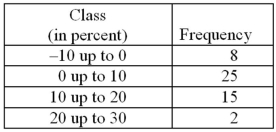 Refer to Exhibit 2-9.The number of stocks with returns of less than 10% is _____.
A) 8
B) 25
C) 33
D) 48
Correct Answer:

Verified
Correct Answer:
Verified
Q85: When displaying quantitative data,what is an ogive
Q86: Exhibit 2-7.Thirty students at Eastside High School
Q87: For quantitative data,a cumulative frequency distribution records
Q88: A frequency distribution for qualitative data groups
Q89: Construct a stem-and-leaf diagram with the following
Q91: Exhibit 2-14.In the accompanying stem-and-leaf diagram,the values
Q92: Exhibit 2-10.Automobiles traveling on a road with
Q93: Exhibit 2-3.A city in California spent six
Q94: Exhibit 2-7.Thirty students at Eastside High School
Q95: When constructing a frequency distribution for quantitative