Multiple Choice
Exhibit 2-7.Thirty students at Eastside High School took the SAT on the same Saturday.Their raw scores are given next. 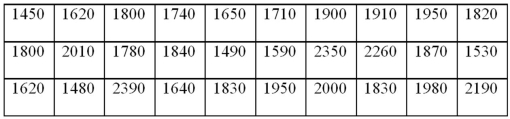 Refer to Exhibit 2-7.Consider a frequency distribution of the data that groups the data in classes of 1400 up to 1600,1600 up to 1800,1800 up to 2000,and so on.What is the approximate relative frequency of students who scored more than 1600 but less than 1800?
A) 0.17
B) 0.23
C) 0.40
D) 0.77
Correct Answer:

Verified
Correct Answer:
Verified
Q89: Construct a stem-and-leaf diagram with the following
Q90: Exhibit 2-9.An analyst constructed the following frequency
Q91: Exhibit 2-14.In the accompanying stem-and-leaf diagram,the values
Q92: Exhibit 2-10.Automobiles traveling on a road with
Q93: Exhibit 2-3.A city in California spent six
Q95: When constructing a frequency distribution for quantitative
Q96: The accompanying cumulative relative frequency distribution shows
Q97: Exhibit 2-1.An auto parts chain asked customers
Q98: Exhibit 2-13.The organization of the Girl Sprouts
Q99: Use the following data to construct a