Multiple Choice
Exhibit 2-5.The following data represent scores on a pop quiz in a statistics section: 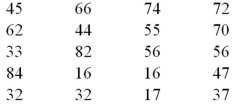 Refer to Exhibit 2-5.Suppose the data is grouped into 5 classes,and one of them will be "30 up to 44"-that is,{x;30 ≤ x < 44}.The frequency of this class is ____.
A) 0.20
B) 0.25
C) 4
D) 5
Correct Answer:

Verified
Correct Answer:
Verified
Q23: What graphical tool is best used to
Q28: For which of the following data sets
Q51: A statistics instructor computes the grade and
Q53: Exhibit 2-2.The following is a list of
Q54: Exhibit 2-9.An analyst constructed the following frequency
Q55: In the following pie chart representing a
Q59: What type of relationship is indicated in
Q60: Exhibit 2-3.A city in California spent six
Q61: Exhibit 2-4.Students in Professor Smith's Business Statistics
Q79: An ogive is a graph that plots