Multiple Choice
Exhibit 2-2.The following is a list of five of the world's busiest airports by passenger traffic for 2010. 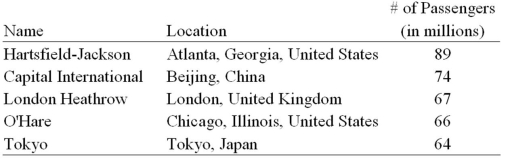 Refer to Exhibit 2-2.The percentage of passenger traffic in the five busiest airports that occurred in Asia is closest to __________.
A) 18%
B) 21%
C) 25%
D) 38%
Correct Answer:

Verified
Correct Answer:
Verified
Q23: What graphical tool is best used to
Q28: For which of the following data sets
Q48: Exhibit 2-11.The accompanying relative frequency distribution represents
Q49: Exhibit 2-13.The organization of the Girl Sprouts
Q50: The accompanying chart shows the number of
Q51: A statistics instructor computes the grade and
Q54: Exhibit 2-9.An analyst constructed the following frequency
Q55: In the following pie chart representing a
Q56: Exhibit 2-5.The following data represent scores on
Q79: An ogive is a graph that plots